Most chips are designed in one order. An architecture is chosen early, from estimates on paper and in a software sketch of the chip. Then it is built out. Gate-level detail, and with it the real cost of each circuit, only arrives once the architecture is frozen. If the gates disagree with the sketch, the fix usually waits for the next chip.
Part 3 named the four levels of detail a pre-silicon number can stand on. In the usual order, the more detail a number has, the fewer designs have it: many ideas on paper, a few in a sketch, a handful simulated cycle by cycle, and one at the gates, after the choice is made.
The order, reversed
We start at the bottom. First the circuits: 304 of them so far, each placed, routed and simulated gate by gate at the 5 nm class, glitches included. Then the designs: whole chips, each a model and its silicon together, with every token it would write measured on those circuits for its time and energy. We have costed over ten million design points that way.
Figure 1. Detail against breadth
How many designs a chip program evaluates at each level of detail. The usual program is a sketch of the common pattern, not a measurement; ours is from the search’s records.
The circuits are measured at the Gate level; the whole-chip figures are our estimate until silicon
To be exact: the circuits are measured at the gate level, and every token of every design is measured on them. The whole-chip figures are our estimate until silicon. So this isn’t ten million gate-level simulations. It’s ten million designs, every token measured on the same placed and routed circuits, before we pick one.
Set the quality; we return the design
A search needs a question. Ours is the one part 3 argued for: set the quality bar first, then find the least energy × delay that clears it, inside a power and area budget.
For the data-center envelope, 125 W and 575 mm², with every person holding a 16K-token conversation on the chip, the search evaluated 522,675 designs. 322,941 of them fit the budget, and 313 are on the front: no design in the budget beats one of them on both quality and energy × delay. Set a bar, and the answer is the cheapest design on the front that clears it.
Figure 2. Every design the search evaluated, and the one it returned
The data-center envelope: 125 W and 575 mm², each person with a 16K-token conversation. Of 522,675 designs evaluated, 322,941 fit the budget and 313 are on the front. A seeded sample of 6,000 is drawn, lighter where the design is over the budget.
Pre-silicon 5 nm class, every design costed the same way
Every point is a whole design with its own model, and a different trade between how good the answers are and what each one costs. Ask for better answers and the cost climbs; accept worse ones and it falls. The front shows the trade before anything is built, and the bar decides it.
We know what every token costs
A design’s figures come from its tokens. For any token, anywhere in a conversation, we measure its time through the chip in clock cycles and its energy in picojoules, on placed and routed circuits. One token from the design the search returned, written with the full 16K-token conversation behind it, takes 50 µs and 0.52 mJ, its share of the chip’s leakage included.
This is what part 3 asked of any pre-silicon number: the whole model, not one kernel multiplied up. A design’s tokens a second and tokens a joule follow from each token’s cycles and energy.
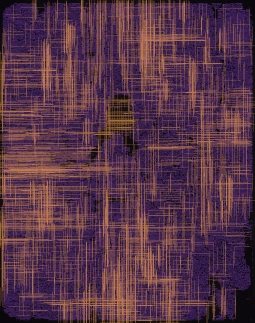
Figure 3. One math engine, placed and routed
One of the data-center design’s math engines, placed and routed as it will be made: every cell and every wire. Circuits like this one, measured gate by gate, are where every token of every design in the search is measured.
Pre-silicon 5 nm class
What the search returned
At the preset bar, the search returned the data-center design: 526 mm² of its 575, 125 W, twelve people at once, each with a 16K-token conversation held on the chip and each getting 19,921 tokens a second, at 0.52 mJ a token.
Against an NVIDIA B300 serving the same twelve people Qwen3 1.7B in FP8, decoding only, each person’s next token comes 110 times sooner, at 690 times less energy. No setting closes the gap: serving sixteen, its most efficient, the B300 still spends 660 times the energy a token, and serving one, its fastest, it’s still 43 times slower. The design’s token, at 0.52 mJ, sits under the 0.89 mJ floor part 2 measured: its model is distilled for the job and held to Qwen3 1.7B’s quality. A smaller model wouldn’t rescue the GPU: part 1 measured one sixteen times smaller running only three times as fast. Most of the gain is the chip.
Figure 4. The design against a B300, like for like
The B300 serving Qwen3 1.7B in FP8 at every setting we measured, one person to sixteen; the design serving twelve at the same quality. Each person holds a 16K-token conversation; decoding only. The amber line runs from the B300 serving the same twelve to the design. Both scales are logarithmic: each gridline is ten times the last.
Measured on an NVIDIA B300 Pre-silicon 5 nm class: the design
At 19,921 tokens a second, a draft of six tokens for a frontier model takes 0.3 ms, well inside the millisecond or more the frontier model takes to check them on its GPUs. Part 6 takes that up.
Why it matters
A chip program usually answers its question once. The search answers it again every time the question changes. A new model for the same job loads as new weights, on the same silicon. A new class of model, a new quality bar or a new power or area budget is a re-run of the search that returns a new design in days, not a new chip program. The same circuits give the data-center design at 125 W and designs for smaller budgets.
It is also how we work with partners. Bring a workload and a quality bar, and the search returns a design fitted to them, costed the same way, token by token.
Where it sits
Keeping a model in on-chip memory isn’t new, and the chips that do it are good at what they were built for. Groq’s LPUs, NVIDIA’s LPX decode racks and Cerebras’s wafer all serve large models fast from on-chip memory, spread across a lot of silicon. Taalas builds one model into its chip. d-Matrix’s cards already sit beside GPUs. Ours is fitted differently: the whole small model on one die sized for it, the silicon and the model chosen together, as a card beside any accelerator, with a new model for the same job loading as weights.
Tools that tune one fixed design’s layout, or explore architectures on assumed costs, are common too. This search does something else: it chooses the architecture and the model together, and costs each choice down to the cycle and picojoule of each token, on placed and routed circuits.
How we know
Pre-silicon 5 nm classMeasured on an NVIDIA B300Simulated from both
- The circuits
- 304 so far, each placed, routed and simulated gate by gate for power at the 5 nm class, glitches included. They are measurements on the flow, not on silicon.
- The designs
- Every token a design’s model writes is measured on those circuits for its time and energy. Its figures are our estimate until silicon, and every chip figure here is labeled pre-silicon.
- The search
- Over ten million design points costed. For the data-center envelope at 16K tokens of conversation: 522,675 designs evaluated, 322,941 within 125 W and 575 mm², 313 on the front. Figure 2 draws a seeded sample of 6,000. Quality is bits per byte on our probe texts, lower is better; energy × delay is a token’s energy times the time between one person’s tokens.
- The B300
- One NVIDIA B300, vLLM as shipped, Qwen3 1.7B in its published FP8 checkpoint, 15K tokens in and 1K out, one to sixteen people at once, decoding only, measured on 16 October 2026. Energy is the board’s mean power over decoding time; the time between a person’s tokens is the median. Part 2 says what a tuned stack would change.
- What isn’t here
- What the search varies and how it narrows, the floorplans and the engines’ own figures. They are for partners, under NDA.